Picture this: you’re a VP of Customer Service who spent the better part of last quarter evaluating BPO partners. You got multiple quotes, compared providers side by side, and landed on a number that felt reasonable. The process looked rigorous. You signed the contract and moved on.
The problem isn’t that you did the work. It’s that all of that work happened inside the same narrow slice of the market. The comparison was real, but the sample was skewed from the start, and that skewed sample is now your benchmark.
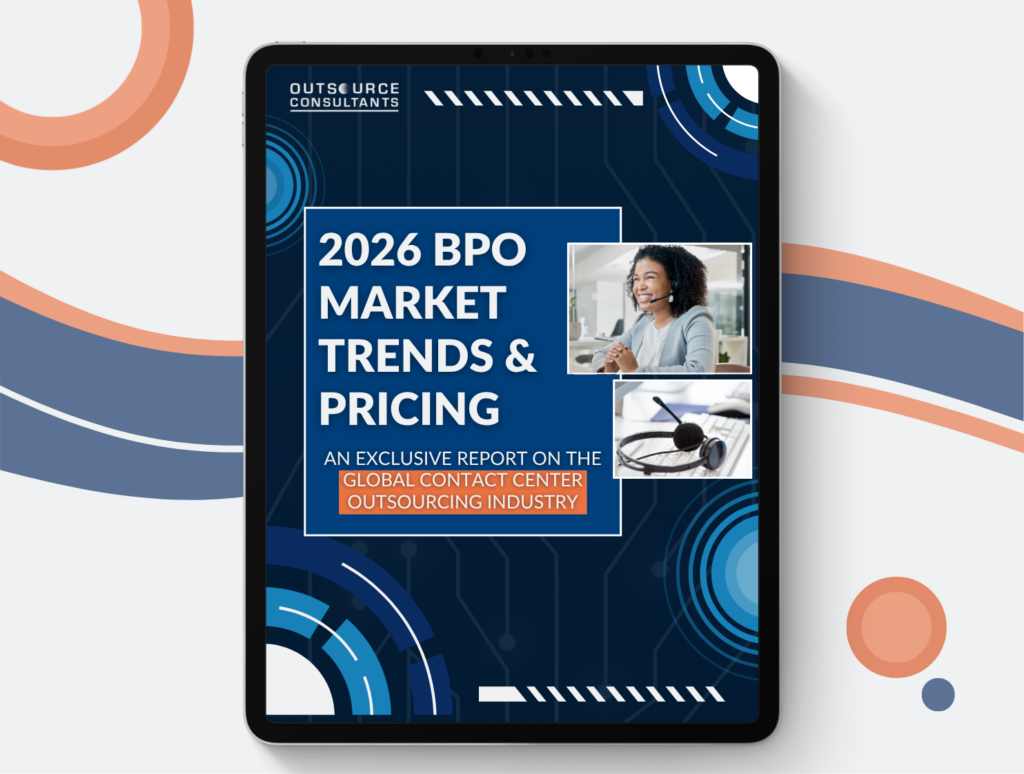
That’s the situation most CX leaders are in right now, and it’s exactly why we built the 2026 BPO Market Trends & Pricing Guide. It’s the market picture most buyers never get to see. Download it here.
But before you do, here are a few things that stood out to us when we were pulling it together.
The Problem with Your CX Benchmarking Strategy
Most CX leaders don’t realize their benchmark is broken because the process that produced it looked like due diligence. Multiple quotes. Side-by-side comparisons. Careful deliberation. That feels rigorous, and in a lot of ways, it is.
The issue is where those quotes came from.
Think about it this way: if you wanted to know what a kitchen renovation costs and you called three luxury contractors, compared their bids carefully, and landed on a number, you’d feel informed. But you’d have priced the renovation against one tier of the market and one tier only. The comparison was sound. The sample wasn’t.
That’s the benchmarking trap most CX leaders are in. Every quote, every contract, every reference point came from the same tier of provider, usually large global BPOs with the brand recognition and sales infrastructure to show up first in every evaluation. The mid-market exists, is significant, and is delivering comparable or stronger outcomes at dramatically different price points. Most buyers never see it because they don’t have a guide into it.
That’s a solvable problem. But it helps to understand what the rate landscape actually looks like in 2026 before you can solve it.
How Much Are Contact Center Rates in 2026?
Here’s one of the things that stood out when we were building the guide: the gap between large global BPO rates and mid-market rates is wider than most buyers expect. Here’s a glimpse at what we’re seeing across a few key regions for Tier-1 English voice and general customer support:
| Region | Large Global BPOs | OC’s Mid-Size BPOs | Avg. Savings |
|---|---|---|---|
| US & Canada | $36 – $50/hr | $29 – $37/hr | 24% |
| Nearshore | $16 – $22/hr | $13 – $20/hr | 13% |
| Asia Pacific | $12 – $20/hr | $9 – $17/hr | 20% |
For the full breakdown across all six regions, download the guide.
Nearshore markets that felt like obvious bargains two or three years ago have moved. Buyers shopping on rates from a 2023 proposal are walking into conversations with a number in their head that no longer reflects what the market actually looks like. In some regions, they’re leaving meaningful savings on the table without knowing it. In others, the story is more nuanced than a simple cost comparison can capture.
Rates alone, though, don’t tell you where to go. The location decision is more layered than most buyers account for, and it comes down to three factors that don’t always point in the same direction.
The Three Factors That Impact Location Criteria for Contact Center Selection
Where your BPO sits on the map is one variable. But three factors actually determine whether a location works for your program:
- Cost efficiency measures how a market’s rates compare to the global baseline, accounting for labor, location, and total service cost.
- CX quality captures how consistently a market delivers on CSAT, QA scores, average handle time, and customer effort.
- Attrition stability measures agent tenure and workforce turnover over time. This one is easy to underweight in an evaluation because it doesn’t show up in the proposal. It shows up six months into the program.
These three factors don’t move together, and that’s where buyers get tripped up. A market can score well on cost and poorly on attrition stability, meaning the savings you see on paper get quietly eaten by turnover and retraining cycles. A market can look expensive on an hourly basis and outperform on total program cost because the workforce is tenured and CSAT is consistently high.
“Some markets getting heavy attention right now come with watchpoints buyers aren’t accounting for. Some markets that don’t make the default shortlist are strong, stable performers in 2026.”
When you map all three factors across 20-plus markets the way we did in the guide, patterns emerge that run counter to a lot of conventional BPO wisdom. The guide shows you where those are.
Which is exactly why the cost of getting this decision wrong is higher than most buyers realize.
Wrong Decisions Are Costly in Time, Money, and Risk
A misaligned BPO decision doesn’t announce itself. It doesn’t show up as a line item that says “wrong vendor.” It shows up gradually, in ways that are easy to rationalize quarter over quarter:
- CSAT scores trending the wrong direction
- Agent churn you’re constantly absorbing
- Retraining cycles that quietly erode your cost savings
- Management hours spent firefighting a program that never quite performs the way the proposal said it would
And here’s the part worth sitting with: staying the course isn’t a neutral choice. Every quarter you’re running on an outdated benchmark or a misaligned vendor is a quarter you’re actively absorbing that cost. Inaction has a price, and it compounds.
Most CX leaders already sense something is off. What’s usually missing isn’t the motivation to act. It’s a current, credible market picture that makes the case clearly enough to do something about it. The 2026 BPO Market Trends and Pricing Guide is built to be that picture. It gives you:
- Current rate data to benchmark your cost
- Regional performance ratings to evaluate quality
- Attrition data to pressure-test stability before you commit
Get the Data. Make a Better Decision.
The market is more varied, more nuanced, and more full of options than a standard vendor shortlist will ever surface. The 2026 BPO Market Trends and Pricing Guide puts the full picture in one place.
Download the report and see where your current program stacks up. Or if you’d rather talk through what the data means for your specific situation, book a CX Strategy Call and we’ll walk through it together.